System Partitioning (and Predicting Tides)
Today we're looking at how to kick off projects with very high level goals by referring back to the AnyTide project.
Back in 2013, the National Oceanography Centre approached Winchester Innovation (an earlier incarnation of this company) to generate impact using their bathymetric model and tidal prediction technologies.
The steps taken were :
- Refine the product idea
- Review the market
- Elaborate the use cases
- Elaborate the system
- Define monetization
- Choose the tooling and methodology
- Deploy and maintain
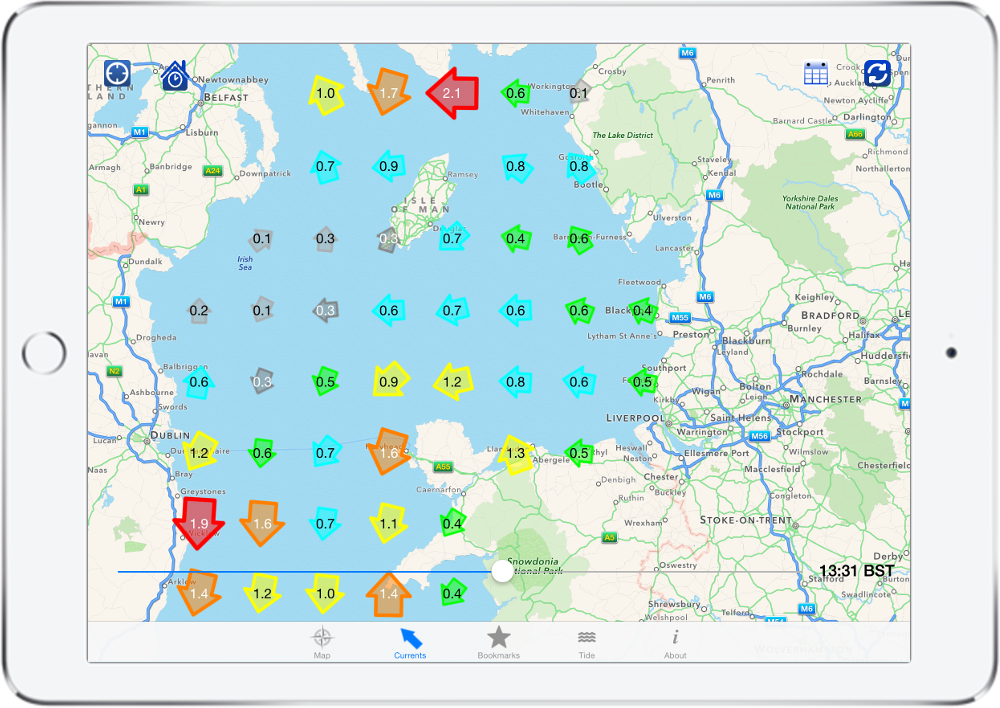
This is neatly summarized in a presentation at the British Geological Survey Smartphone Conference, with the resulting app going live in Android and iOS app stores in late 2013 and remaining for many years. See the Archive.org link for the iOS version here.
One key aspect to this process is system partitioning, shown in slide 13. Maximally satisfying a number of competing goals such as user experience, security, data protection and performance requires a great deal of experience of desiging and building complex systems.
The net result was a very popular and unique app with many tens of thousands of users. It was later upgraded to become a global tidal prediction app before being retired in 2021.
The app generated much user value and publicity over the years.
If you are a university or company with under-utilized intellectual property, talk to us about turning it into impactful products and publicity.
3rd November 2023
Maximising software value and managing those bicycle shed walls
On a previous project in a large organisation, we had a phrase 'the bicycle shed walls', for referring to management procrastination through focussing on the trivial.
Today, we manage software using an agile process, with a task 'backlog' (aka todo list) and weekly client/user meetings to prioritise the next weekly 'sprint' of activity.
It's vital that these weekly meetings avoid procrastination.
 Photo by
 Users talk about what is familiar to them, which is generally the user interface features, 'can we make it so that if we click on that, it does this ?' or 'can we move this button ?'. More so in the initial phases where the software is an isolated 'island' detached from their day-to-day, this is what we want to change. Without appropriate framing, these discussions risk being akin to deciding on 'Impulsive Purple' or 'Plum Dandy' for the bicycle shed walls.
We have to frame the discussion around outcomes and benefits to the user's 'world'. And how will this software change their 'world' for the better ? Use this lens for discussions around features and priorities.
Do this and you'll find your new software tools provide more business benefits for the money and deliver them more quickly.
And the bike shed walls may grow a little tatty.
20th Oct 2022
Server Monitoring with Grafana and Prometheus
When building out 'Digital Twins' and remote condition monitoring (RCM) systems, it's more important than ever to know the state of the system doing the monitoring. Over the past few months we've been adding just that to our RCM system which runs as a set of Docker containerized micro-services on a Digital Ocean Droplet (basically a data centre hosted Linux rack PC).
We use the industry leading Grafana dashboard app with some of its huge library of open source dashboards. The Prometheus tool is used to scrape metrics from the micro services and feed the data into Grafana. Prometheus also has functionality to create alerts by email / SMS to on-call DevOps staff.
In general, each microservice comes with a ready made metrics generator. For postgres it is pgexporter, Cadvisor for monitoring Docker and ClickhouseDB has its own metrics generator. We use node_exporter to generate metrics for the host PC itself.
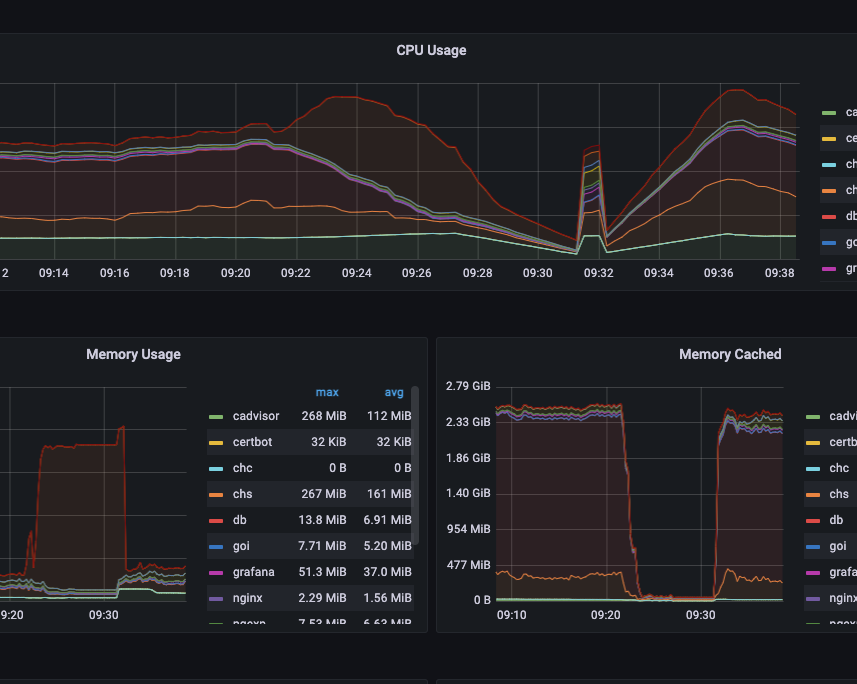
Once configured, deployed and hardened, the results are excellent. For instance, we've long known about an issue whereby if a user picks a particularly long time range for a chart plot, it will overload the system. The screen grab shown picked up when a user did just that. As priorities dictate, we'll code the solution to it. In the meantime, we've identified and fixed many other issues, delivering a welcome GUI speed-up as a bonus.
We can see whether we're over or under provisioned with CPU, disk and memory, and quickly flag up any Dockerized micro-services that need attention.
It's a game changer.
If any of this is of interest to you and your cloud or SaaS or IoT or Digital Twin RCM system, then please contact us.
4th April 2022
Time Series Database (TSDB) Technologies
We're developing a remote condition monitoring system that has been saving time series data into a PostgreSQL database hosted on a DigitalOcean Droplet
and Volume.
It is working well as a proof of concept, which is the intention.
However once the number of rows has passed the 5m mark, Plotly Dash chart related time series queries have slowed considerably, from sub 5s to over 40s. We could add some column indices, but this fix won't scale too well. So we have looked into alternative database technologies optimised for time series data storage.
And columnar databases are particularly suited to the task. There are a number to choose from . Further due diligence has led us to take ClickHouse for a spin.
 Photo by
 Using the ClickHouse docker images and Python clickhouse driver libraries, we have quickly deployed a running prototype in a replica Digital Ocean environment. Some pg_dump extraction to TSV, a short Python data transform script and a command line curl load (ETL) later and we have the table replicated in ClickHouse. Time to run the offending time-span query. And the result is .... a drop in query time of over 100x. From over 40s to sub 0.3s.
There are other TSDBs to choose from and we may well test some more. An independent industry standard set of database performance benchmarks would help.
The next stage is to expand the table towards the billion row mark for stress testing.
Do contact us if your projects are using any of the technologies mentioned in these blogs posts, and we'd be happy to help.
28th Jan 2022
DevOps, Data Engineering and MLOps
In the beginning there was software (well actually discreet logic, but we have to start somewhere). Software became more complex, so needed management tools such as Subversion, then Git.
And so on and so on until we arrived at DevOps which is a set of tools and processes used by an organisation to ensure deployed software is fit for purpose.
More software led to more applications and hence more data. New terms started to spring up like 'Data Lake' and 'Big Data'.
This in turn has spawned a new range of '***Ops', namely DataOps or Data Engineering and MLOps for machine learning operations.

Many of these new applications take on a cloud hosted 'pipeline' design pattern whereby data is fed into one end and results come out of the other. Cue another set of tools and terminologies such as genpipes and Python Directed Acyclic Graphs . There are interesting cross-overs with graph based databases such as Neo4j, but that's a topic for another post.
And to prove there really is nothing new, take a look at the 1999 Trimedia Software Streaming Architecture (TSSA) - which certain members of Rockstone Data worked on/with 'back in the day' so to say.
So what do all these 'Ops provide us with ?
The answer is control. Control of your development, R&D, deployment and testing. Without these 'Ops your machine learning data pipeline cloud deployment will at some point become unmanageable.
5th Oct 2021
Digital Twin and Internet of Things Data
It's now standard practice to connect any new piece of machinery or plant to the cloud to record and use the data. Often referred to as creating a 'Digital Twin' or 'The Internet of Things'.
This is partly driven by the almost negligable cost and power requirements of sophisticated embedded systems and by the rise of cloud services such as Amazon AWS and Microsoft Azure with associated state of the art AI and ML tools.
So we are currently installing remote condition monitoring collectors (RCMC) to hundreds of remote devices.
Each RCMC is collecting data from a number of sensors such as:
- Logic signalling events
- Analogue values
- Data recorders
- Electronic control unit logs
- Environmental sensors
- GPS coordinates

Server loading in this case can be predicted, so the choice is to build on a known number of Ubuntu compute instances, in this case in Digital Ocean. The software stack is fully open source, with a micro-services architecture. Data ingest is implemented with token based authentication over SSL (TLS 1.3) using a combination of dockerized nginx reverse proxying to a custom Golang app implementing a RESTful API with JSON body (many alternatives were investigated including MQTT). To achieve a super high performance with reasonable hosting costs, the data is then cached in a dockerized redis in-memory cache. A Python/Django background service then batch reads the data and bulk writes to a combination of SQL and no SQL databases. All dockerized.
Python is a great choice for server implemention because of the many high quality data science libraries available, and because prototyping in PyCharm and Jupyter Notebooks speeds development time. Plus there are many Python developers available worldwide for further development and maintenance. The combination of Go for performance bottlenecks and Python for analysis is a well proven one.
If you are interested in or require help with projects involving any of these topics, please contact us.
2nd July 2021